Apache Pinot was built for one purpose: answer analytical queries at sub-second latency over billions of rows without sacrificing freshness. LinkedIn, Uber, and Stripe run it in production at massive scale because its architecture — columnar storage, distributed servers, and a purpose-built index hierarchy — eliminates the bottlenecks that cripple traditional OLAP systems. Understanding how segments, indexes, and brokers interact is not optional knowledge for teams running Pinot in anger; it is the difference between a system that hits SLAs and one that pages you at 3 a.m. This post walks through every major component, from the Controller's cluster brain down to the StarTree index pre-aggregation trick that shaves 100x off COUNT/SUM queries.
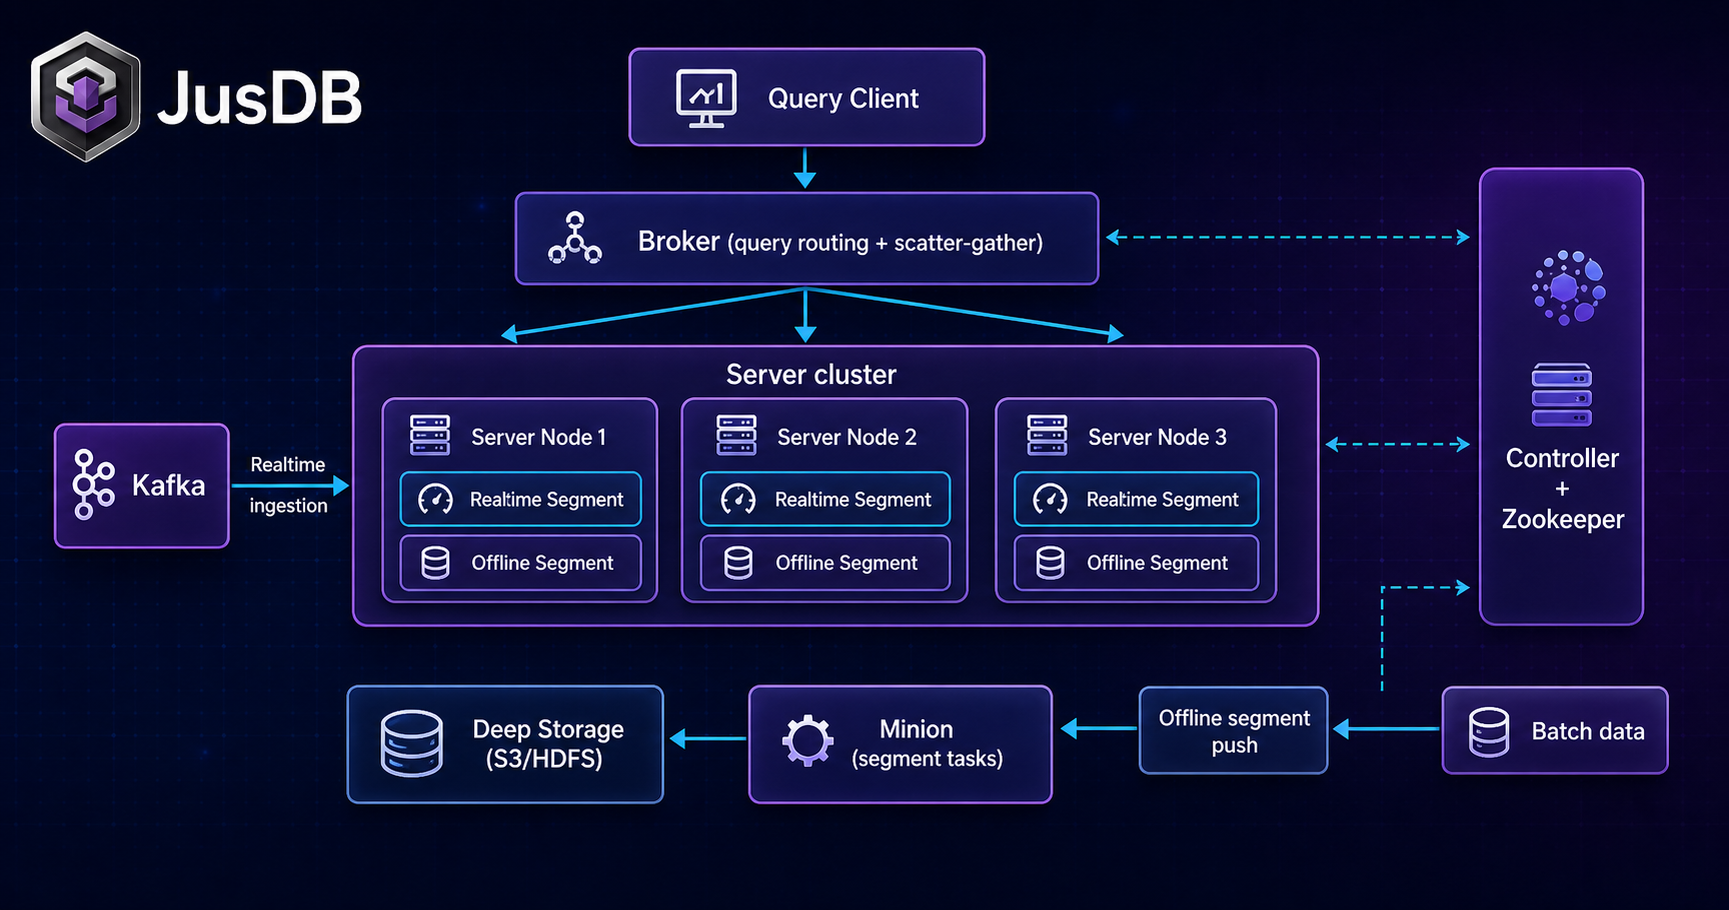
- Pinot splits into four roles: Controller (metadata + assignment), Broker (scatter-gather routing), Server (segment storage + execution), and Minion (async background tasks).
- Segments are immutable, columnar files. Offline segments are batch-loaded; Realtime segments are mutable in-memory before sealing.
- Index types — inverted, sorted, bloom filter, range, JSON, and StarTree — stack on top of columnar storage and are configured per column in the table schema.
- Brokers fan out every query to all relevant servers in parallel, merge partial results, and return in under 100 ms for well-indexed tables.
- StarTree indexes pre-aggregate metric rollups into a tree structure, giving COUNT/SUM/AVG queries a 10–100x speedup at the cost of additional storage.
Pinot Component Architecture
Pinot splits operational responsibility across four distinct process types. Each role has a precise contract, and understanding that contract is the foundation for capacity planning, failure isolation, and performance tuning.
Controller — The Controller is the cluster brain. It runs atop Apache Helix and ZooKeeper, maintaining all table configurations, schema definitions, segment assignment states, and instance metadata. When a new offline segment is uploaded or a realtime segment seals, the Controller decides which Server instances host which replicas using a configurable assignment strategy (balanced, replica-group, or table-level isolation). It also runs the periodic rebalance loop that re-assigns segments when servers join or leave. Controllers are stateless themselves — all durable state lives in ZooKeeper — so you can run multiple Controllers for high availability with a single leader elected via Helix.
Broker — Brokers receive SQL (or PQL) queries from clients and translate them into a scatter-gather execution plan. They read the routing table from ZooKeeper, which maps each table's segments to their hosting Server instances, and fan the pruned query out to every relevant server in parallel. Once partial results arrive, the Broker merges them (aggregating counts, sorting, applying HAVING filters) and returns the final result. Brokers are stateless and horizontally scalable; add more Brokers to increase query concurrency without touching Servers.
Server — Servers are where data lives and computation happens. Each Server hosts a local set of segments on disk (or SSD), loads them into memory-mapped structures, and executes the fragment of a query assigned by the Broker. Servers maintain two segment stores: an offline store for immutable sealed segments and a realtime consuming store for in-progress Kafka partition consumption. Servers report segment state changes back through Helix, which notifies the Controller and updates the routing table used by Brokers.
Minion — The Minion cluster handles async background operations that would be too expensive or disruptive to run inline: segment merging (combining small segments into larger ones for better scan throughput), purging records for GDPR compliance, converting realtime segments to the offline format, and running custom transformation tasks. Minions pull task definitions from the Controller's task manager API and report completion status back. Running Minions separately from Servers ensures that background I/O does not compete with query-critical CPU on Server nodes.
| Component | Stateful? | Scales for | Key Dependency |
|---|---|---|---|
| Controller | No (ZK-backed) | Metadata ops, HA | ZooKeeper, Helix |
| Broker | No | Query concurrency | ZooKeeper routing table |
| Server | Yes (local disk) | Data volume, throughput | Controller (assignment), Helix |
| Minion | No | Background task parallelism | Controller task manager |
Segment Lifecycle
The segment is Pinot's fundamental unit of storage and the atom of assignment. Every segment is an immutable, self-contained columnar file that bundles raw column data, forward indexes, inverted indexes, and metadata into a single directory that gets serialized to a tar.gz before upload to deep storage (typically S3 or HDFS).
Offline segments follow a batch ingestion path. An external pipeline (Spark, Hadoop, or the Pinot Spark connector) reads source data, calls the SegmentCreationDriver to build the columnar layout and all configured indexes, and pushes the resulting segment file to the Controller via the segment upload REST API. The Controller assigns the segment to Server replicas according to the assignment strategy and writes the assignment to ZooKeeper. The target Servers download the segment from deep storage, load it into their local segment store, and notify Helix that the segment is ONLINE. At that point, the Broker's routing table is updated and the segment becomes queryable — no downtime, no cluster restart.
Realtime segments follow a streaming path. Each Server hosting a realtime table partition starts a consuming thread that pulls records from Kafka (or Kinesis) and writes them into a mutable in-memory segment (the "consuming" segment). This segment is immediately queryable for the most recent data. When a configured threshold is crossed — either a row count limit, a time boundary, or a consumption time limit — the consuming segment seals: it flushes to disk in the offline columnar format, uploads itself to deep storage, and transitions to an ONLINE immutable segment. A new consuming segment starts immediately on the next offset. This seal-and-replace loop is what gives Pinot its "real-time" label while preserving the immutability guarantees that make fast querying possible.
The following segment metadata JSON shows a realistic column-level encoding and index configuration as stored in the segment's metadata.properties:
{
  "segment.name": "events_OFFLINE_1732060800000_1732147199000_0",
  "segment.table.name": "events_OFFLINE",
  "segment.total.docs": 4800000,
  "segment.creation.time": "1732147300000",
  "segment.start.time": "1732060800000",
  "segment.end.time": "1732147199000",
  "segment.time.unit": "MILLISECONDS",
  "columns": {
    "event_id": {
      "dataType": "STRING",
      "encoding": "DICTIONARY",
      "compressionCodec": "SNAPPY",
      "hasInvertedIndex": false,
      "hasBloomFilter": true,
      "hasSortedIndex": false,
      "cardinality": 4800000
    },
    "event_type": {
      "dataType": "STRING",
      "encoding": "DICTIONARY",
      "compressionCodec": "LZ4",
      "hasInvertedIndex": true,
      "hasBloomFilter": false,
      "hasSortedIndex": false,
      "cardinality": 42
    },
    "user_id": {
      "dataType": "LONG",
      "encoding": "RAW",
      "compressionCodec": "ZSTANDARD",
      "hasInvertedIndex": false,
      "hasBloomFilter": true,
      "hasSortedIndex": false,
      "cardinality": 1200000
    },
    "ts_epoch_ms": {
      "dataType": "LONG",
      "encoding": "RAW",
      "compressionCodec": "PASS_THROUGH",
      "hasInvertedIndex": false,
      "hasBloomFilter": false,
      "hasSortedIndex": true,
      "cardinality": 4800000
    },
    "revenue_usd": {
      "dataType": "DOUBLE",
      "encoding": "RAW",
      "compressionCodec": "SNAPPY",
      "hasInvertedIndex": false,
      "hasBloomFilter": false,
      "hasSortedIndex": false,
      "cardinality": 98000
    }
  },
  "starTreeIndexConfigs": [
    {
      "dimensionsSplitOrder": ["event_type", "user_id"],
      "skipStarNodeCreationForDimensions": [],
      "functionColumnPairs": ["COUNT__*", "SUM__revenue_usd"],
      "maxLeafRecords": 10000
    }
  ]
}
Index Types in Pinot
Pinot's query performance comes from stacking multiple index types. Each addresses a different query pattern, and the right combination eliminates full column scans entirely for the most common access paths.
Forward Index is the baseline — every column has one. For low-cardinality strings, Pinot uses dictionary encoding: the column stores integer IDs referencing a compact dictionary, cutting raw storage by 60–80% on typical event dimensions. High-cardinality or raw numeric columns skip the dictionary and store values directly with configurable compression (Snappy, LZ4, Zstandard).
Inverted Index maps each dictionary value to the set of document IDs that contain it — essentially a posting list. For a query like WHERE event_type = 'purchase', Pinot looks up the dictionary ID for "purchase", fetches the posting list, and reads only those rows. On a column with cardinality 42 over 4.8 million rows, this reduces the scan from 4.8M row reads to roughly 114K — a 42x reduction before any other optimization kicks in.
Sorted Index applies when a column is the physical sort key of the segment. Pinot stores a per-segment min/max range and uses binary search to locate matching rows. Only one column per segment can carry the sorted index, so choose the most selective time or partition column — usually the primary time column. Sorted indexes also enable merge-join style operations across segments.
Bloom Filter is a probabilistic membership test applied at the segment level before the Server even opens the segment file. If a query predicates on event_id = 'evt_abc123' and the bloom filter for that segment reports "definitely not present," the Server skips the segment entirely. False positive rate is configurable (default 5%); lower rates cost more memory but reduce unnecessary segment opens.
Range Index (formerly the range inverted index) handles range predicates like revenue_usd BETWEEN 100 AND 500 efficiently using a sorted posting structure. Without it, range predicates fall back to scanning the forward index sequentially.
StarTree Index is the most powerful and most misunderstood index in Pinot's toolkit. It pre-aggregates metric values along a dimension tree during segment creation, embedding a cube-style rollup directly inside the segment file. When a query like SELECT event_type, SUM(revenue_usd), COUNT(*) FROM events GROUP BY event_type arrives, instead of scanning 4.8 million raw rows and summing revenue per group, Pinot walks the StarTree's pre-aggregated nodes and returns the answer in microseconds. The tree structure covers every prefix combination of the configured dimension split order; "star nodes" represent wildcard rollups that aggregate across an entire dimension level. The result is a 10–100x speedup for COUNT, SUM, MIN, MAX, and AVG queries on high-cardinality tables — the exact queries that break traditional OLAP systems at scale. The trade-off is additional segment size (typically 10–30% overhead) and longer segment build time.
Put the dimension with the lowest cardinality first in dimensionsSplitOrder for the StarTree index. This maximizes star node sharing across the tree and minimizes both index size and lookup time. For the example above, event_type (cardinality 42) before user_id (cardinality 1.2M) is the correct ordering.
Query Routing via Brokers
The Broker's scatter-gather loop is the path every query takes, and its latency profile directly determines the P99 your application observes.
When a query arrives at the Broker, it first parses and validates the SQL, then consults the in-memory routing table — a snapshot of the ZooKeeper segment assignment state, refreshed every few seconds. The routing table tells the Broker which segments exist for the queried table and which Server instance (and replica) hosts each segment. The Broker applies time-based partition pruning at this stage: if the query carries a WHERE clause on the time column, segments whose time ranges do not overlap the predicate are excluded from the fan-out entirely. This is segment pruning at the routing layer, before any Server work happens.
After pruning, the Broker constructs per-Server sub-queries that list exactly the segments each Server should scan. It dispatches these sub-queries in parallel over Netty connections to all relevant Servers simultaneously — this is the "scatter" phase. Each Server executes its fragment independently: opens the relevant segments, applies column-level bloom filter checks, runs inverted or sorted index lookups, executes the scan and aggregation on filtered rows, and returns a partial result set.
The "gather" phase begins as partial results stream back. The Broker merges them: summing COUNT and SUM partials, merging sorted ORDER BY results, applying HAVING predicates, and enforcing LIMIT. The final merged result is serialized and returned to the client. End-to-end, a well-indexed query on a properly sized cluster — bloom filters eliminating cold segments, inverted indexes shrinking hot segment scans, StarTree nodes short-circuiting aggregations — completes this full scatter-gather cycle in under 100 ms even across tens of billions of rows.
-- Query that hits StarTree index directly (no raw row scan)
SELECT
  event_type,
  COUNT(*) AS total_events,
  SUM(revenue_usd) AS total_revenue
FROM events
WHERE ts_epoch_ms BETWEEN 1732060800000 AND 1732147199000
GROUP BY event_type
ORDER BY total_revenue DESC
LIMIT 20;

-- Broker routing: prunes to segments overlapping the ts_epoch_ms range
-- Server execution: StarTree lookup for COUNT__* and SUM__revenue_usd
-- Expected latency: <20ms on 4.8M row segments with StarTree configuredReplica-group routing must be explicitly enabled in the table config ("replicaGroupStrategyConfig") for the Broker to route a single query to one replica group instead of all replicas. Without it, the Broker fans out to every replica of every segment, multiplying Server CPU load by the replication factor on every query — a common cause of unexpected CPU saturation after increasing replication for durability.
Tuning for Low-Latency Queries
Reaching sub-100 ms P99 consistently requires addressing the full stack: segment layout, index selection, Server JVM tuning, and Broker configuration.
Segment size targeting. Pinot performs best with segments between 200 MB and 500 MB on disk. Segments smaller than 100 MB create excessive scatter-gather fan-out (the Broker must coordinate more Server round trips). Segments larger than 1 GB increase individual Server scan time and make rebalancing slow. Use Minion merge tasks to consolidate small realtime-sealed segments into the target range nightly.
Column sort order. Designate the most selective time column as the sorted column. This enables binary search within segments and powers the Broker's time-range pruning. For tables queried predominantly by a single dimension (user_id in a per-user analytics table), sort by that dimension instead and accept slightly weaker time pruning in exchange for dramatically faster point lookups.
Index coverage. Apply inverted indexes to every low-to-medium cardinality dimension column that appears in WHERE predicates. Apply bloom filters to high-cardinality ID columns used in equality lookups. Configure StarTree indexes for every table that serves dashboards with GROUP BY aggregations — the storage overhead pays for itself within the first week of production traffic.
Server memory sizing. Pinot uses memory-mapped segment files, so the OS page cache is the primary I/O buffer. Size Server heap at 16–32 GB for JVM metadata and query execution, and provision physical RAM at 2–3x the hot working set size to keep frequently-accessed segments in page cache. Cold segments that fall out of cache trigger disk reads, which are the dominant source of tail latency spikes.
Broker query timeout and adaptive server selection. Set timeoutMs per query type (dashboard queries: 5000 ms, API queries: 500 ms) and enable adaptive server selection in the Broker config. Adaptive selection tracks per-server EWMA latency and routes segments to the fastest replica, automatically avoiding stragglers during GC pauses or network hiccups.
| Tuning Lever | Target Value | Impact |
|---|---|---|
| Segment size | 200–500 MB | Reduces fan-out and rebalance time |
| Inverted index cardinality threshold | < 1M unique values | 10–50x predicate filtering speedup |
| StarTree maxLeafRecords | 10,000–100,000 | Controls tree depth vs. index size trade-off |
| Server heap (JVM) | 16–32 GB | Reduces GC-induced tail latency |
| Page cache (RAM) | 2–3x hot working set | Eliminates disk reads for hot segments |
| Broker timeoutMs (dashboard) | 5,000 ms | Prevents slow queries from blocking thread pool |
- Pinot's four-component architecture (Controller, Broker, Server, Minion) separates metadata management, query routing, data execution, and background maintenance into independently scalable layers.
- Segments are immutable columnar files. Offline segments are batch-built; realtime segments are mutable until they seal, at which point they become queryable offline segments — giving Pinot both freshness and scan efficiency.
- Index selection is the highest-leverage tuning action available. Inverted indexes eliminate the majority of row reads for low-cardinality filter columns; StarTree indexes eliminate raw row scans entirely for GROUP BY aggregation queries, delivering 10–100x speedups.
- Broker scatter-gather is fully parallel. Every query fans out to all relevant servers simultaneously, and per-server partial results are merged in memory. Replica-group routing must be explicitly configured to avoid multiplying Server load by the replication factor.
- Segment size (200–500 MB), sort column selection, page cache provisioning, and adaptive server selection are the four knobs that move P99 latency most reliably in production environments.
- Minion tasks (merge, purge, conversion) run asynchronously and must be sized and scheduled to prevent small-segment proliferation from degrading query fan-out over time.
Working with JusDB on Apache Pinot
Designing a Pinot cluster that actually delivers sub-100 ms P99 in production requires getting dozens of decisions right simultaneously: segment sizing, index strategy, Server memory layout, Broker configuration, Minion scheduling, and replication topology. JusDB's database engineering team has deployed and tuned Apache Pinot clusters at scale across analytics, ad-tech, and financial services workloads. We handle schema design, StarTree index configuration, realtime ingestion pipeline architecture, and ongoing performance tuning so your engineering team can focus on building product rather than fighting the cluster.