
TL;DR — ClickHouse in 60 seconds: ClickHouse is a columnar OLAP database designed for sub-second analytics on billions of rows. Its core is the MergeTree family of table engines — sort keys, partitioning, and async merges in the background give it 10-100× the throughput of Postgres or MySQL for aggregations. The default ReplicatedMergeTree handles HA via ZooKeeper / ClickHouse Keeper; Distributed engine shards across nodes; ReplacingMergeTree handles updates; AggregatingMergeTree pre-computes rollups. ClickHouse 24.x adds vector search (cosine, L2), parallel replicas, and lakehouse access (Iceberg, Delta). Use it for: real-time dashboards, log analytics, customer-facing analytics, ad-hoc OLAP. Skip it for: OLTP, frequent row updates, JOIN-heavy star schemas (use StarRocks).
A fintech client came to us last year with a straightforward problem: their PostgreSQL-based reporting pipeline was taking 45 minutes to run a daily aggregation across 800 million transaction rows. They'd already thrown hardware at it — r6g.8xlarge, 256GB RAM, optimized indexes. Still 45 minutes.
We moved the analytics workload to ClickHouse. The same query: 4.2 seconds.
That's not a cherry-picked edge case. That's what columnar storage + vectorized execution does when matched to the right workload. This guide explains when ClickHouse is the right call, how to architect it correctly, and — equally important — when not to use it.
- ClickHouse is a columnar OLAP database — not a replacement for PostgreSQL or MySQL
- Best for: analytics on billions of rows, log aggregation, dashboards, ad-tech, IoT telemetry
- Wrong choice for: transactional workloads, frequent single-row updates, complex JOINs across many tables
- MergeTree engine selection is the most important architectural decision — get it wrong and you'll fight performance forever
- Materialized Views are the secret weapon — most teams underuse them
What Makes ClickHouse Different
Traditional databases like PostgreSQL and MySQL store data row by row. When you run SELECT sum(revenue) FROM orders WHERE date > '2024-01-01', the database reads every column of every matching row, even if you only need two columns. For OLAP queries on wide tables, this is enormously wasteful.
ClickHouse stores data column by column. That same query reads only the revenue and date columns — skipping everything else. On a 200-column table, that's the difference between scanning 200× the data you need versus exactly the data you need.
Combine that with:
- Vectorized execution: Processes 1,024 values at a time using SIMD CPU instructions — dramatically higher throughput per clock cycle than row-at-a-time processing
- LZ4/ZSTD compression: Columnar data compresses 5–10× better than row data, meaning less I/O on every query
- Data skipping indexes: Each part stores min/max values per block, allowing the query engine to skip entire blocks of data without reading them
- Distributed execution: Queries parallelize across all shards and replicas automatically
The result is a database that can aggregate billions of rows in seconds on commodity hardware.
Architecture Deep Dive
The MergeTree Engine Family
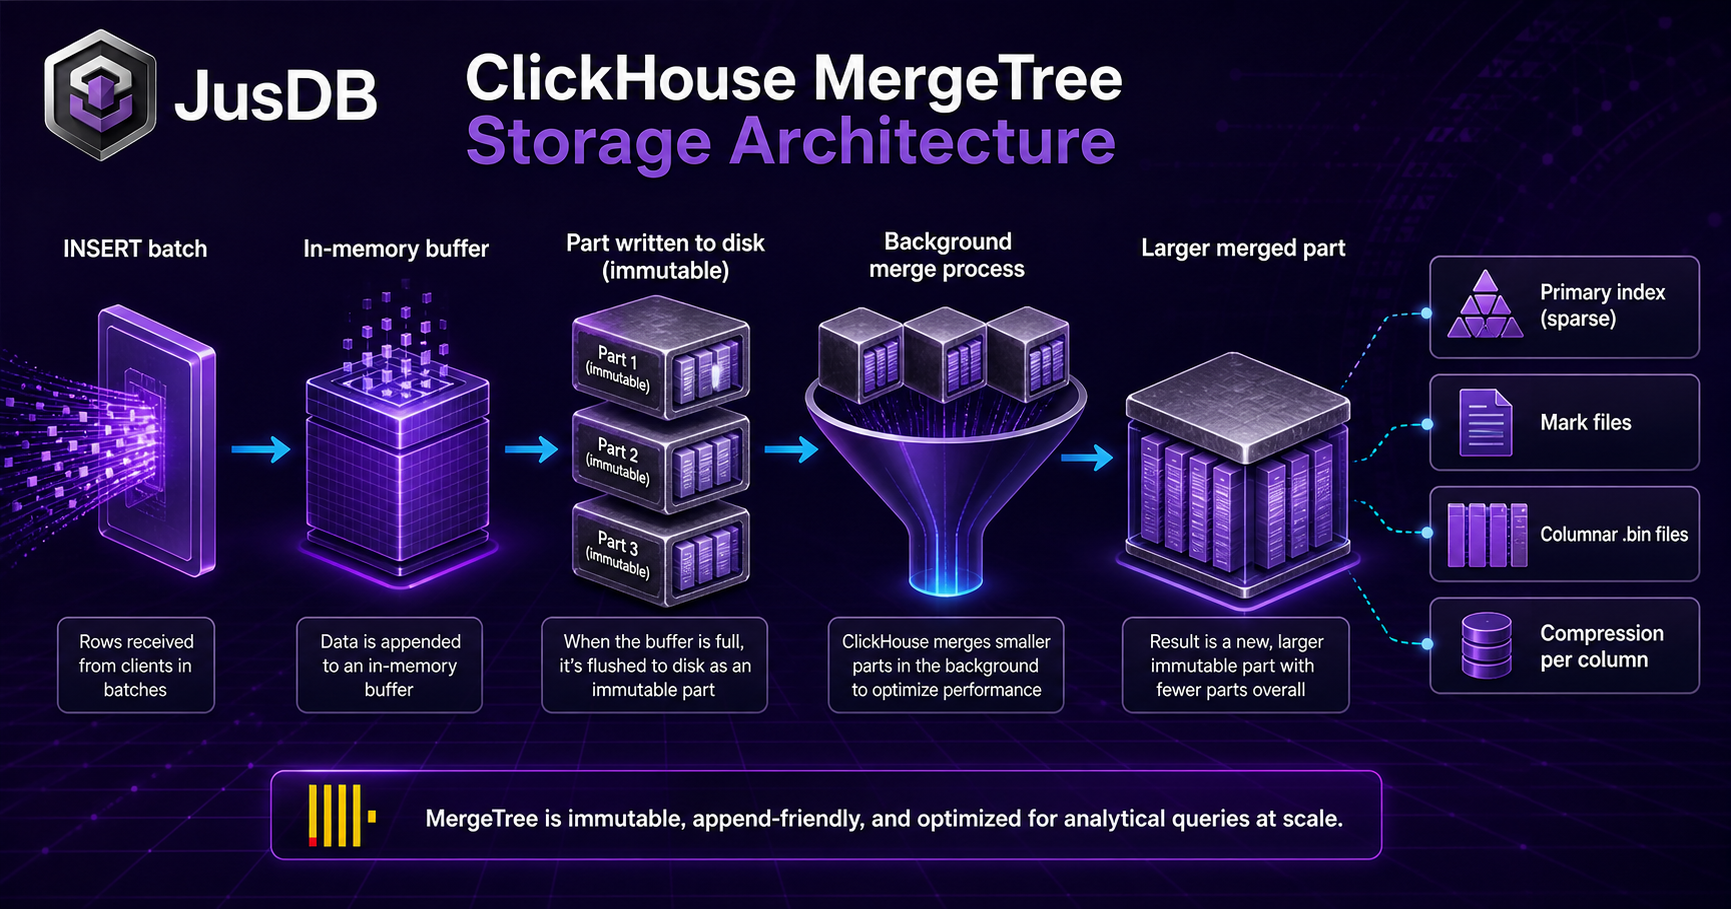
MergeTree is the core storage engine. Everything else is built on it. Choosing the wrong variant is the single most common mistake we see in ClickHouse deployments:
| Engine | Use Case | Key Behavior |
|---|---|---|
| MergeTree | Immutable event data (logs, clickstream) | Baseline. Keeps all rows, sorts by ORDER BY key |
| ReplacingMergeTree | Latest-state records (user profiles, inventory) | Deduplicates on primary key during background merge |
| SummingMergeTree | Pre-aggregated counters | Merges rows by summing numeric columns |
| AggregatingMergeTree | Materialized View backing | Stores partial aggregation states, merges incrementally |
| CollapsingMergeTree | Mutable rows with explicit delete markers | Sign column (+1/-1) controls row visibility |
| ReplicatedMergeTree | Any of the above with HA | Adds ZooKeeper/ClickHouse Keeper replication |
Our recommendation for most teams: Start with ReplicatedMergeTree for all production tables. The replication overhead is minimal and you avoid a painful migration later if you need HA.
How Inserts and Merges Work
This is the part that catches teams off-guard: ClickHouse doesn't write data directly to its final location. Inserts create small parts on disk. Background merge threads continuously consolidate these parts into larger, sorted, compressed parts.
-- Check current part count and size
SELECT
    table,
    count() AS parts,
    formatReadableSize(sum(bytes_on_disk)) AS disk_size,
    sum(rows) AS total_rows
FROM system.parts
WHERE active AND database = 'analytics'
GROUP BY table
ORDER BY sum(bytes_on_disk) DESC;
If you insert in tiny batches (one row at a time), you'll create thousands of parts and hit "Too many parts" errors. Minimum batch size for production: 10,000 rows per INSERT. Ideal: 100,000–1,000,000 rows per batch.
-- WRONG: one row at a time (destroys performance)
INSERT INTO events VALUES (now(), 1001, '/home', 30);

-- RIGHT: batch inserts via HTTP interface
echo "2025-01-15 10:00:00,1001,/home,30
2025-01-15 10:00:01,1002,/pricing,15" | \
  clickhouse-client --query="INSERT INTO events FORMAT CSV"

-- Or batch from application
client.insert('events', rows_list, column_names=['event_time','user_id','url','duration'])
Schema Design: Getting the ORDER BY Right
The ORDER BY (primary key) in ClickHouse is not just for uniqueness — it determines the physical sort order of data on disk. Queries that filter on the ORDER BY columns can use the sparse primary index to skip entire granules (8,192 rows by default). Queries that filter on other columns do full scans.
-- Log analytics table — good ORDER BY
CREATE TABLE access_logs (
    event_date  Date,
    event_time  DateTime,
    user_id     UInt64,
    url         String,
    status_code UInt16,
    duration_ms UInt32,
    bytes_sent  UInt64
) ENGINE = ReplicatedMergeTree('/clickhouse/tables/{shard}/access_logs', '{replica}')
PARTITION BY toYYYYMM(event_date)
ORDER BY (event_date, user_id, event_time)  -- most common filter columns first
SETTINGS index_granularity = 8192;
Rules for ORDER BY selection:
- Put the highest-cardinality filter column last, lowest-cardinality first (e.g.,
date, tenant_id, user_id) - Time is almost always the first or second column for time-series data
- Once set, ORDER BY cannot be changed without rewriting the table — get it right upfront
Partition Design
-- Monthly partitions for log data (good default)
PARTITION BY toYYYYMM(event_date)

-- Daily partitions for high-volume data (> 1TB/day)
PARTITION BY toDate(event_time)

-- Drop old partitions instantly (no DELETE overhead)
ALTER TABLE access_logs DROP PARTITION '202401';
Partitions are the unit of data management in ClickHouse. Dropping a partition is instantaneous — it just removes a directory. This makes TTL management trivial for time-series data.
Materialized Views: The Secret Weapon
Most teams use ClickHouse for raw event storage and run aggregation queries at query time. Teams that really squeeze performance use Materialized Views to pre-aggregate data at insert time.
-- Raw events table
CREATE TABLE events (
    event_time DateTime,
    user_id    UInt64,
    url        String,
    duration   UInt32
) ENGINE = ReplicatedMergeTree(...)
PARTITION BY toDate(event_time)
ORDER BY (toDate(event_time), url);

-- Pre-aggregated view: hourly URL stats
CREATE MATERIALIZED VIEW url_stats_hourly
ENGINE = AggregatingMergeTree()
PARTITION BY toDate(hour)
ORDER BY (hour, url)
AS SELECT
    toStartOfHour(event_time) AS hour,
    url,
    countState() AS visit_count,
    avgState(duration) AS avg_duration
FROM events
GROUP BY hour, url;

-- Query the materialized view — sub-millisecond for billions of source rows
SELECT
    hour,
    url,
    countMerge(visit_count) AS visits,
    round(avgMerge(avg_duration), 0) AS avg_ms
FROM url_stats_hourly
WHERE hour >= toStartOfDay(today())
GROUP BY hour, url
ORDER BY visits DESC
LIMIT 20;
With this pattern, your dashboard query hits pre-aggregated data that's updated incrementally as events arrive. We've used this to power dashboards showing real-time metrics over 50 billion events with sub-100ms query times.
Query Optimization
Use EXPLAIN to understand query plans
EXPLAIN indexes = 1
SELECT url, count() AS views
FROM access_logs
WHERE event_date >= '2025-01-01'
  AND user_id = 1001
GROUP BY url
ORDER BY views DESC;

-- Look for:
-- ReadFromMergeTree (parts read vs skipped)
-- Keys condition: shows which index conditions apply
-- Initial parts: X, Selected parts: Y  (Y << X = good)
Data Skipping Indexes for non-ORDER BY columns
-- Add a bloom filter index for string equality lookups
ALTER TABLE access_logs ADD INDEX url_bloom_idx url
TYPE bloom_filter(0.01) GRANULARITY 1;

-- Minmax index for range queries on numeric columns
ALTER TABLE access_logs ADD INDEX duration_minmax duration
TYPE minmax GRANULARITY 4;

-- Materialize the index on existing data
ALTER TABLE access_logs MATERIALIZE INDEX url_bloom_idx;
Avoid these patterns
-- BAD: wildcard at start of LIKE (full scan, no index)
SELECT * FROM access_logs WHERE url LIKE '%checkout%';

-- BETTER: use startsWith or position()
SELECT * FROM access_logs WHERE startsWith(url, '/checkout');

-- BAD: high-cardinality GROUP BY without ORDER BY alignment
SELECT user_id, count() FROM events GROUP BY user_id;  -- scans everything

-- BETTER: filter by date first to limit scan range
SELECT user_id, count() FROM events
WHERE event_date = today()
GROUP BY user_id;
ClickHouse vs PostgreSQL vs StarRocks
| Dimension | ClickHouse | PostgreSQL | StarRocks |
|---|---|---|---|
| Storage model | Columnar | Row (+ columnar via extensions) | Columnar |
| OLAP query speed | Excellent | Moderate | Excellent |
| OLTP (transactions) | Not suitable | Excellent | Limited |
| Concurrency (many users) | Moderate | Good | Excellent (CN nodes) |
| Lakehouse (Iceberg/Parquet) | Via table engines | Via foreign data wrappers | Native |
| UPDATE/DELETE | Heavy (use CollapsingMergeTree) | Native MVCC | Primary key updates supported |
| Best for | Log analytics, observability, ad-tech | Transactional apps, mixed workloads | Real-time dashboards, API serving |
Many of our clients run ClickHouse alongside PostgreSQL — Postgres handles writes and OLTP, ClickHouse handles analytics and reporting. The two complement each other well, especially with a CDC pipeline (via Flink CDC) streaming changes from Postgres into ClickHouse.
Deployment Patterns
Single Node (Development / Small Scale)
# Docker quickstart
docker run -d \
  --name clickhouse-server \
  -p 8123:8123 \
  -p 9000:9000 \
  -v $(pwd)/data:/var/lib/clickhouse \
  clickhouse/clickhouse-server:latest

# Connect
clickhouse-client --host localhost --port 9000
Replicated Cluster (Production)
-- config.xml: define cluster topology
<remote_servers>
  <analytics_cluster>
    <shard>
      <replica>
        <host>ch-node-01</host>
        <port>9000</port>
      </replica>
      <replica>
        <host>ch-node-02</host>
        <port>9000</port>
      </replica>
    </shard>
    <shard>
      <replica>
        <host>ch-node-03</host>
        <port>9000</port>
      </replica>
      <replica>
        <host>ch-node-04</host>
        <port>9000</port>
      </replica>
    </shard>
  </analytics_cluster>
</remote_servers>

-- Create distributed table on top of local tables
CREATE TABLE events_dist AS events
ENGINE = Distributed('analytics_cluster', 'default', 'events', rand());
ClickHouse Cloud
ClickHouse Cloud handles sharding, replication, and upgrades automatically. For teams that don't want to operate the cluster themselves, it's the fastest path to production. Pricing is consumption-based — you pay for queries run, not idle capacity.
Monitoring ClickHouse
-- Active queries (who's running what)
SELECT query_id, user, elapsed, read_rows, memory_usage, query
FROM system.processes
ORDER BY elapsed DESC;

-- Part health (watch for too many parts)
SELECT table, count() AS parts, sum(rows) AS rows
FROM system.parts
WHERE active AND database = currentDatabase()
GROUP BY table
ORDER BY parts DESC;

-- Replication lag
SELECT table, is_leader, absolute_delay
FROM system.replicas
WHERE absolute_delay > 0;

-- Merge queue depth
SELECT table, count() AS pending_merges
FROM system.merges
GROUP BY table;
A healthy ClickHouse cluster has:
- Parts per table: < 300 (alert above 1,000)
- Replication lag: < 10 seconds
- Merge queue: actively draining, not growing indefinitely
- Memory per query: set
max_memory_usageto avoid OOM on large queries
When NOT to Use ClickHouse
This is the part most guides skip. ClickHouse is the wrong tool when:
- You need row-level updates frequently: Every UPDATE in ClickHouse rewrites entire parts. If you're updating individual records, use PostgreSQL.
- You have complex multi-table JOINs: ClickHouse prefers wide, denormalized tables. Joining 10 normalized tables is painful compared to a star schema or pre-joined flat table.
- Your query concurrency is high (100s of concurrent users): ClickHouse excels at a few heavy queries, not thousands of light ones. For high-concurrency serving, StarRocks or a materialized PostgreSQL cache may serve better.
- Your insert volume is low (< 1M events/day): The operational overhead of ClickHouse is only worth it at scale. For smaller datasets, TimescaleDB on Postgres handles analytics workloads with less complexity.
Working with JusDB on ClickHouse
We've architected and operated ClickHouse clusters ranging from single-node setups handling 10M events/day to distributed clusters ingesting 500M events/day for ad-tech and observability platforms. Common engagements include:
- Schema and MergeTree engine review: We see ORDER BY and engine selection mistakes in almost every self-built cluster we audit. A 2-hour review often unlocks 5–10× query speedups.
- Materialized View design: Designing the right pre-aggregation strategy for your dashboard queries.
- Migration from PostgreSQL or Cassandra: Moving analytics workloads to ClickHouse with zero data loss.
- Production cluster operations: Monitoring, alerting, merge health, and incident response.
If your ClickHouse cluster is slow, parts are accumulating, or you're evaluating ClickHouse for a new analytics platform, talk to us. We're happy to do a free 30-minute architecture review.
Related reading: StarRocks vs ClickHouse deep dive | ClickHouse Consulting | Database Performance Optimization
Frequently Asked Questions
What is ClickHouse and what is it best for?
How does MergeTree work in ClickHouse?
ORDER BY key and written to small immutable parts on disk. A background process asynchronously merges these parts into larger ones. Queries skip entire data parts via primary-key index granules (default 8192 rows per granule), so even a 10TB table scans a tiny fraction. Variants: ReplicatedMergeTree (HA), ReplacingMergeTree (idempotent inserts), AggregatingMergeTree (pre-aggregated rollups), CollapsingMergeTree (logical deletes).ClickHouse vs PostgreSQL — when to use which?
How does ClickHouse handle updates and deletes?
FINAL — insert new versions, merge collapses duplicates by sort key. ClickHouse 23.3+ added lightweight deletes (DELETE FROM ... WHERE ...) which mark rows for deletion without rewriting parts.What's the difference between ClickHouse, StarRocks, and Druid?
Does ClickHouse support vector search?
Array(Float32) with L2Distance / cosineDistance functions and ANN index types (annoy, usearch). Production scale: ~10M vectors with sub-100ms p99. For larger scale, dedicated vector DBs (Qdrant, Weaviate) still win, but for hybrid analytics-+-vector workloads ClickHouse is uniquely well-suited.How do I deploy ClickHouse in production?
storage_policy.What are common ClickHouse pitfalls in production?
SET join_algorithm = 'partial_merge' or migrate JOIN-heavy workloads to StarRocks. (5) Schema migrations on multi-TB tables — mutations are expensive; design schema once, evolve via views.